Notes on configuring Amazon CloudWatch to monitor my Mastodon server

📖
You can read more of my posts on running your own Mastodon server right here: https://www.micahwalter.com/tag/mastodon/
It’s day 2 of running my own Mastodon server. It’s been going pretty well so far now that I am have something working and I’ve migrated my account over. This morning I woke up to a feed filled with posts from the “fediverse!”
I realized that I really would like a simple way to monitor my server. I can of course always log into the server itself and use the CLI to check out what’s going on, but a more centralized dashboard where I can monitor all the other parts, and send myself alerts if things go off the rails would be really nice to have.
For this I turned to Amazon CloudWatch. Here are my notes:
What do I want to monitor?
The first thing to work through is what I actually want to monitor. In CloudWatch I can see all kinds of metrics, logs and more, but what is actually relevant to me is something I need to think through.
Basically, I came up with the following critical metrics I want to know about:
- CPU – I want to know if I am running out of CPU.
- Memory – I would like to keep tabs on overall memory usage.
- Disk Space – Since I am running PostgreSQL on the server, and currently storing files there too, I am really worried I’ll eventually run out of disk space.
I also thought of a few metrics that would be nice to haves:
- Network In and Out – Spikes in either of these might inform me that something weird is going on.
- S3 Storage – Eventually I’ll get S3 working, and I’ll want to keep tabs on how much storage I am using over time.
- CloudFront – Once my S3 storage is properly configured, I’ll be using CloudFront to serve static images and assets. I want to keep an eye on how much data is transferring out as this will impact my bill.
- Emails – I’m approved for 50,000 email sends a day. Since I am only sending emails to myself, I should expect like 1 or 2 a day. If I see this number spike, something is up.
All of the above metrics are pretty easy to set up in CloudWatch. Aside from Memory and Disk Space, I can configure each of these in a custom dashboard. I can also create CloudWatch Alarms to trigger when any of these metrics go past a threshold, and send me an email to let me know what’s going on.
CloudWatch Agent
Memory and Disk Space require installation of CloudWatch Agent on the server itself. This is actually pretty easy to do. I more or less followed the documentation on this one. The steps at a high level are as follows:
- Create a Role for CW Agent to access AWS resources from EC2
- Attach that role to the EC2 instance
- Install the CW Agent on the EC2 instance – selecting the correct one for Ubuntu on ARM.
- Configure to CW Agent to send the metrics you want.
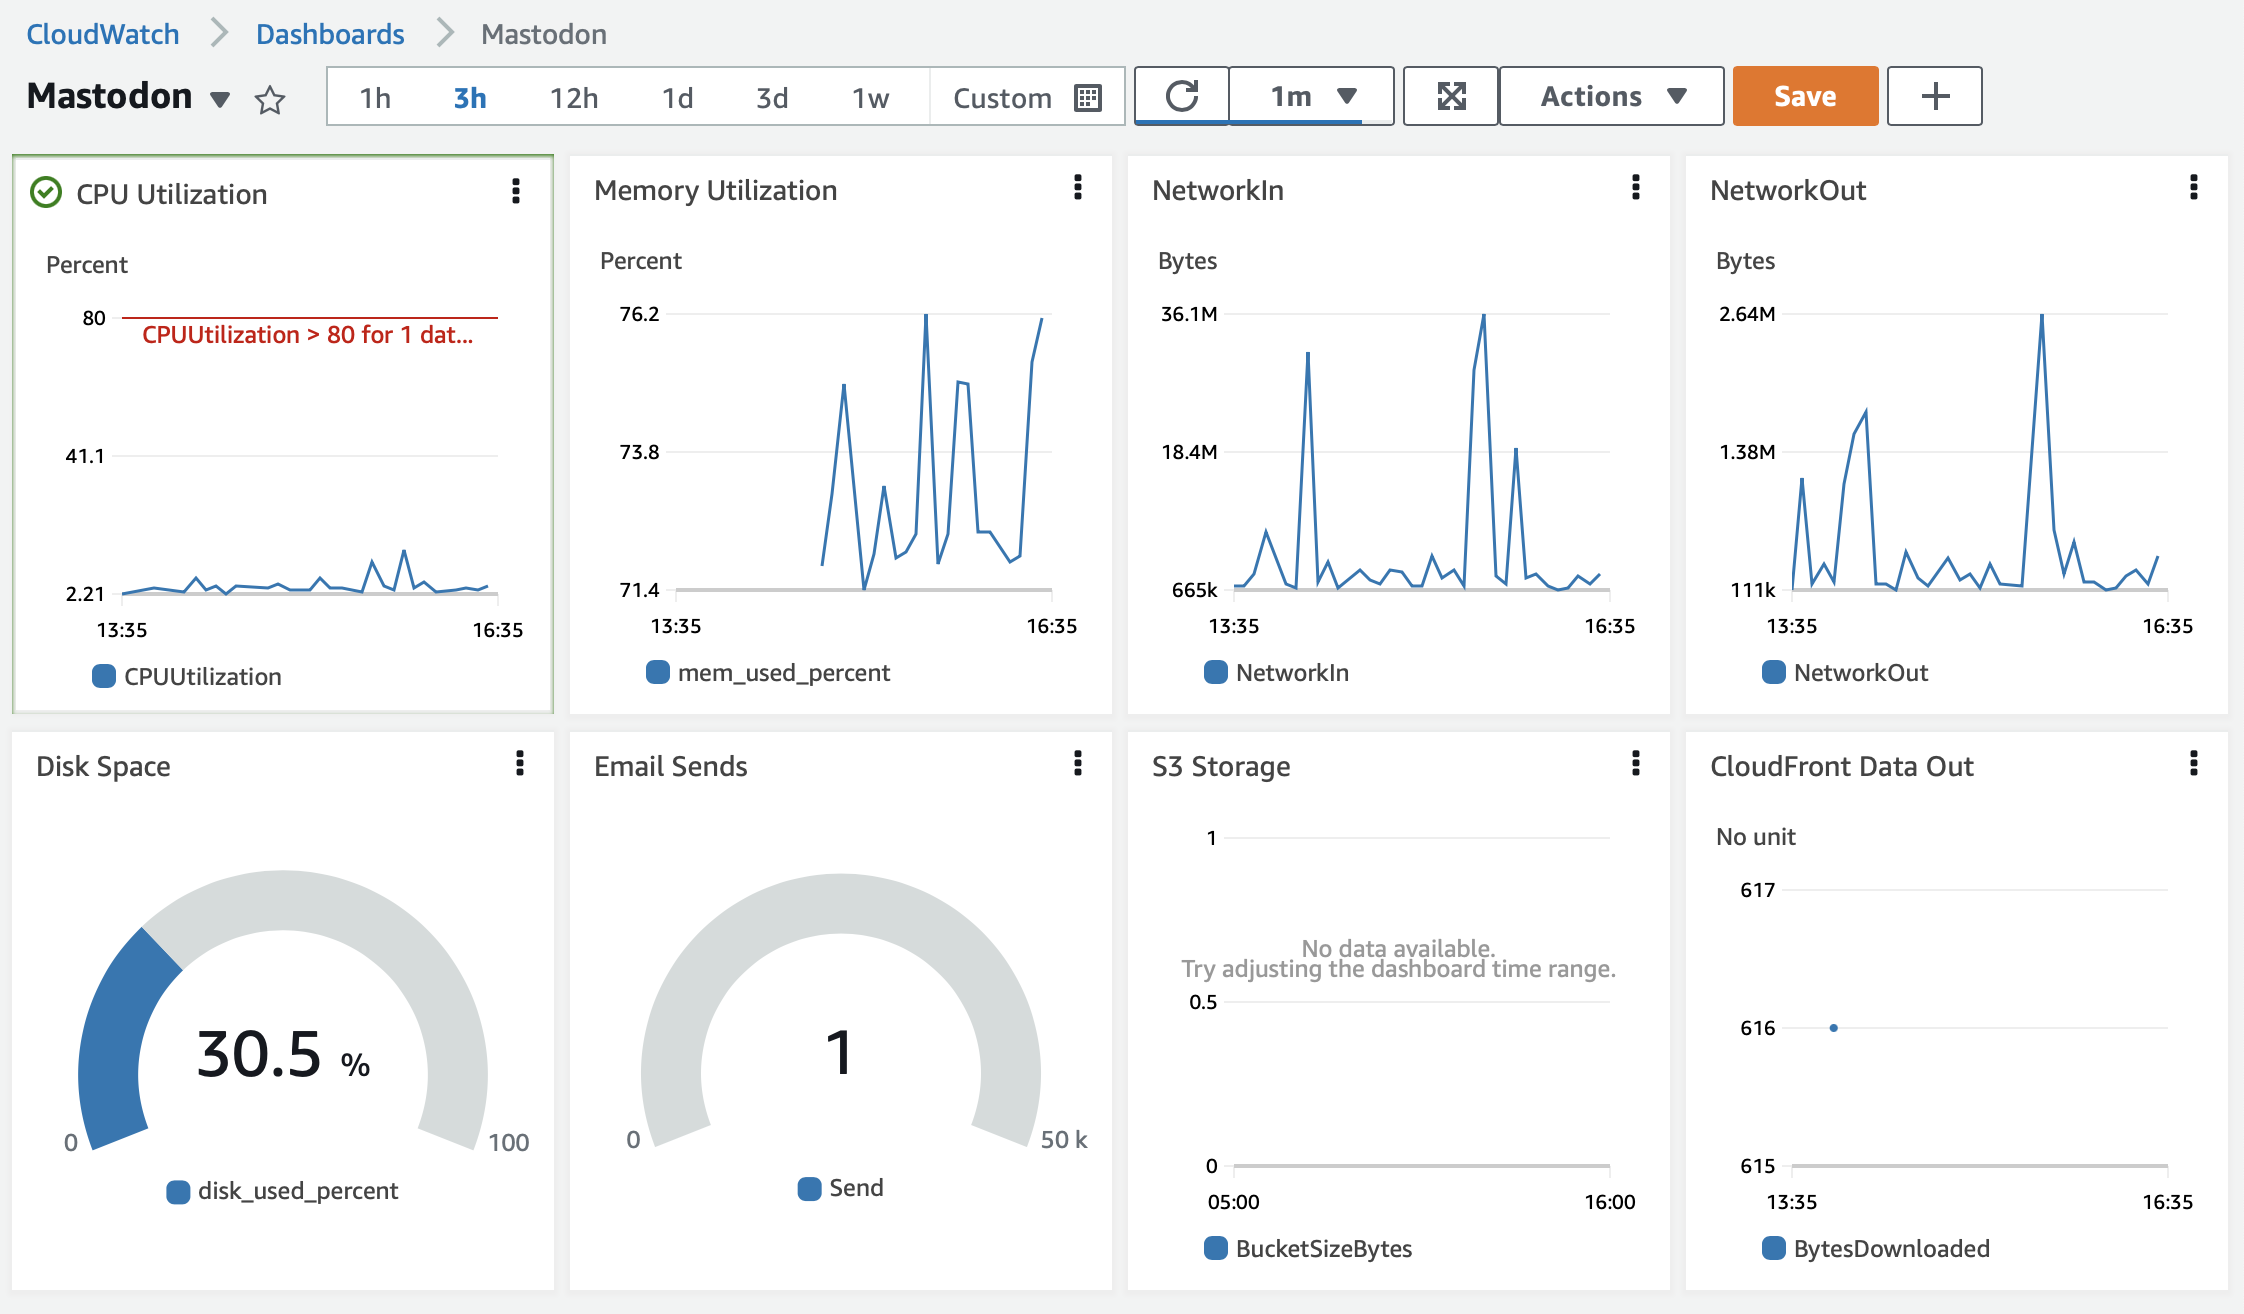
My custom dashboard
In the end, I wound up with this nice looking custom dashboard in CloudWatch and a few alarms set up to monitor the metrics I decided were critical. Here’s what it looks like for now.
📖
You can read more of my posts on running your own Mastodon server right here: https://www.micahwalter.com/tag/mastodon/